The so called Hyperscalers are dominating the cloud market – at least in the news. Amazon and Azure are offering their services to millions of clients. As a small provider we wanted to see how we compare. The results were quite surprising. The key learning – Hyperscale does not equal Hyperspeed, not even close.
The Test
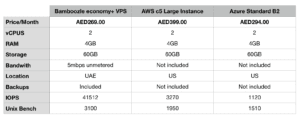
We thought we make things easy and use a very basic Virtual Machine – actually the one we sell most – either as standalone Virtual Server (VPS) or as custom config on our cloud:
- 2 vCPUS
- 4GB RAM
- 60GB Storage
We sell this configuration at 269 AED/Month – you can have a look here.
The Operating System we use centOS 7 with the latest updates – the OS is available in the same configuration on all 3 clouds to avoid any optimized versions. We use KVM as underlying technology, AWS used long time XEN but has nearly completed their move to KVM for their public cloud and Azure is running on Microsofts own Technology based on Hyper-V.
AWS Config
We have chosen a ‘c5.large’ instance inside AWS, with standard SSD storage, as this was the instance closest to our configuration. The instance has CentOS 7 x64 installed with all updates completed, and SELinux disabled. It too has 4GB RAM and 2 CPU cores available.
Azure Config
We have taken a ‘Standard B2s’ virtual machine with CentOS7 x64, which again is around the same price as our solution above. It also has 4GB RAM and 2 CPU cores available. SELinux has been disabled.
In our case Backups and all costs are included while this would be extras on AWS and Azure but for the test this would not be relevant.
To test the principal performance of our machines we decided to run 2 tests, one to test the overall performance under productions workloads – Unix Bench. This is a good choice as it will test the hardware performance and the default template configurations provided as standard, and has a simple scoring system for comparison which we can review later.
The other will be multiple runs of FIO to test the IO Performance of each virtual machine. This is a better test than dd, as in a production environment applications access data randomly across the disks in parallel, and the block sizes will vary massively depending on the workloads running inside the virtual environment. We will run a total of 9 Tests on each machine and will then score based on the overall result.
For those at home who want to run the tests themselves here is what we did on all VMs:
Disable SELinux and install FIO (Reboot to make sure SELinux is disbabled)
yum -y update sed -i -e 's/SELINUX=enforcing/SELINUX=disabled/g' /etc/selinux/config yum -y install fio git gcc screen

[reboot]
Then run the two tests:
Run Unix Bench:
cd; mkdir unixbench; cd unixbench
git init; git clone https://github.com/kdlucas/byte-unixbench
cd byte-unixbench/UnixBench
screen -S benchmark
./Run
Run fio stats:
# Random read/write performance test
fio --randrepeat=1 --ioengine=libaio --direct=1 --gtod_reduce=0 --name=test --filename=random.fio --bs=4k --iodepth=64 --size=4G --readwrite=randrw --rwmixread=75 | grep IOPS; rm -f random.fio
fio --randrepeat=1 --ioengine=libaio --direct=1 --gtod_reduce=0 --name=test --filename=random.fio --bs=256k --iodepth=64 --size=4G --readwrite=randrw --rwmixread=75 | grep IOPS; rm -f random.fio
fio --randrepeat=1 --ioengine=libaio --direct=1 --gtod_reduce=0 --name=test --filename=random.fio --bs=4m --iodepth=64 --size=4G --readwrite=randrw --rwmixread=75 | grep IOPS; rm -f random.fio

# Random read performance test
fio --name=randread --ioengine=libaio --iodepth=16 --rw=randread --bs=4k --direct=1 --size=4G --numjobs=2 --runtime=240 --filename=random.fio --group_reporting | grep IOPS; rm -f random.fio
fio --name=randread --ioengine=libaio --iodepth=16 --rw=randread --bs=256k --direct=1 --size=4G --numjobs=2 --runtime=240 --filename=random.fio --group_reporting | grep IOPS; rm -f random.fio
fio --name=randread --ioengine=libaio --iodepth=16 --rw=randread --bs=4m --direct=1 --size=4G --numjobs=2 --runtime=240 --filename=random.fio --group_reporting | grep IOPS; rm -f random.fio

# Random write performance test
fio --name=randwrite --ioengine=libaio --iodepth=1 --rw=randwrite --bs=4k --direct=1 --size=4G --numjobs=2 --runtime=240 --filename=random.fio --group_reporting | grep IOPS; rm -f random.fio
fio --name=randwrite --ioengine=libaio --iodepth=1 --rw=randwrite --bs=256k --direct=1 --size=4G --numjobs=2 --runtime=240 --filename=random.fio --group_reporting | grep IOPS; rm -f random.fio
fio --name=randwrite --ioengine=libaio --iodepth=1 --rw=randwrite --bs=4m --direct=1 --size=4G --numjobs=2 --runtime=240 --filename=random.fio --group_reporting | grep IOPS; rm -f random.fio
The Result
We believe images say more than words, so here just the comparison of the two tests between the tested clouds.
IOPS (it seems both AWS and Azure are particular stingy on IOPS, which of course hurts overall System performance).
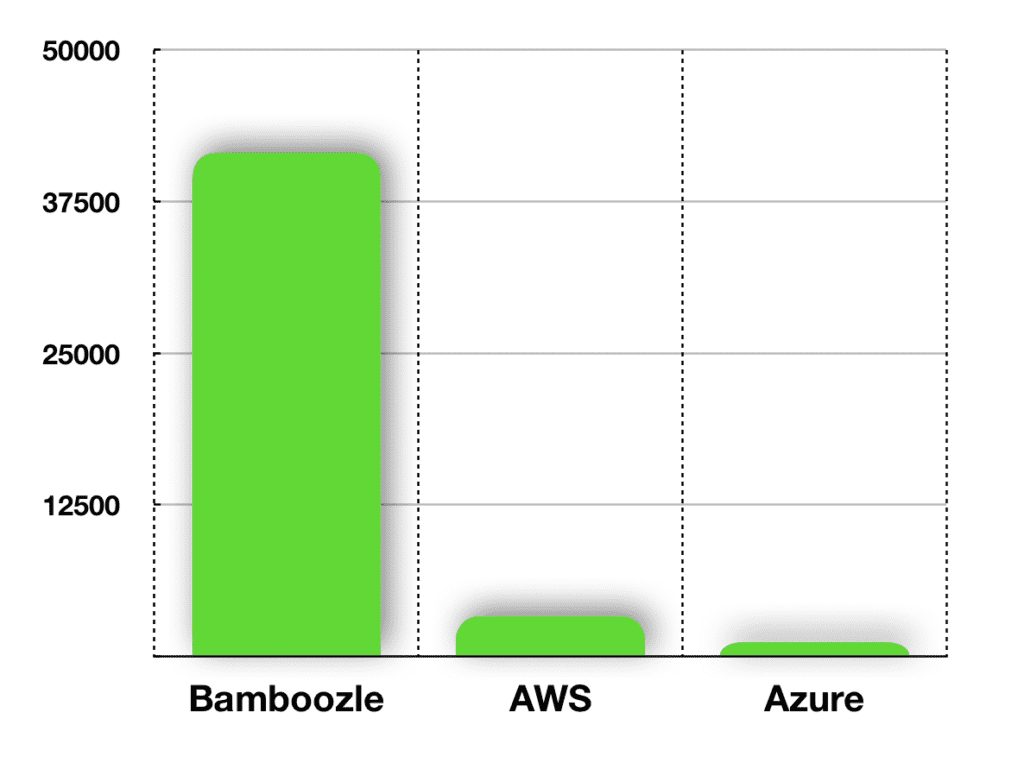
IOPS Performance – Bamboozle vs AWS and Azure
This also explains the Unix Bench Results where the overall performance of the Bamboozle VM beats the Hyperscalers clearly
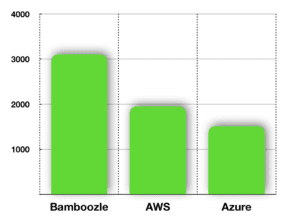
Unix Bench Performance – Bamboozle vs AWS and Azure
Comparing the configurations we can only come to one conclusion – Hyperscale does not mean Hyperspeed.